A river meanders through a forest

Symbolbild: Engineering/ F&E komplexer Systeme, z.B. DSP (digitale Signalverarbeitung), GUI (graphische Bedienoberflächen) A Case for Data Flow Diagrams

Time to Read 4 min

Do you need a quick overview of a complex system? Do you frequently have to explain the functionality of a system? Do you face the task of developing a system from scratch and are not sure about which architecture is the best? Do you need to replace an old system without documentation? In all these cases, data flow diagrams can assist you and help you to simplify communication with other people involved.

Data flow diagrams have sunk into oblivion

Data flow diagrams were defined over 40 years ago as part of the then popular structured analysis (e.g. by Tom DeMarco). Structured analysis uses data flow diagrams to analyze business requirements and map them into software (SW).

With the appearance of object oriented analysis (OOA) and the therein used unified modeling language (UML), data flow diagrams got less important. A big part of this disappearance is because UML does not use pure data flow diagrams. You usually get the advice to simply draw a UML activity diagram, but this diagram type primarily shows the control flow of a software. Additionally, it allows to indicate data flows. However, this mixture of control flow and data flow can make it hard to focus on the essentials when analyzing and designing a new system.

Advantages of data flow diagrams

Using pure data flow diagrams during the early stages of system design has many advantages:

  • Simple notation allows discussion with all relevant people
  • Quick identification of functionality
  • Simplified partitioning of hardware and software
  • SW partitioning into different (interrupt) execution contexts
  • Better identification of interfaces
  • Optimization of redundant processing steps
  • Independence from implementation

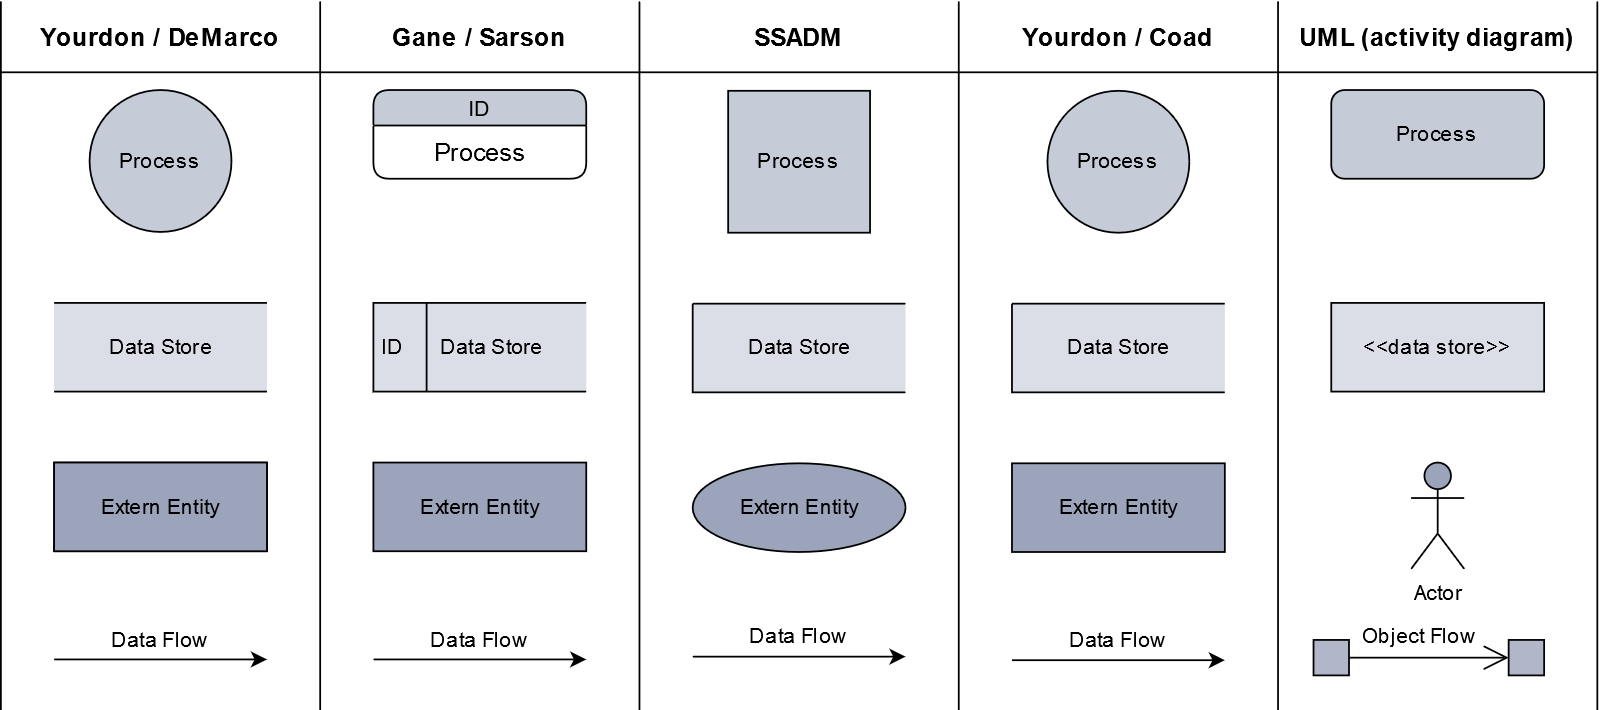
Notation

Data flow diagrams have hardly evolved in the last 40 years. Particularly, no standard notation has been established. However, the basic structures of data flow diagrams are so simple that they are usually understood without further explanation. Hint: Make sure to add a legend and / or a data dictionary to your diagram in order to leave no room for interpretation.

Data flow diagrams consist of the following elements:

  • Processing functions (Process)
  • Storage / databases (Data Store)
  • Start / end points (External Entity)
  • Data flow arrows (Flow)

Some common notations can be found in the following table:

Common notations of data flow diagrams

Additional Benefits of Data Flow Diagrams

Data flow diagrams can even do much more. By using graphical frames and backgrounds in different colors, it is possible to represent a variety of information that is essential to your specific system architecture. Using this method, function and memory blocks can for example be assigned to system components. In particular, the following categories should be considered:

  • HW components
  • SW components
  • SW tasks / processes / interrupt handlers
  • Parts of a distributed system
  • Redundancy

The figure below shows a data flow diagram of a basic data logger consisting of a HW part and two SW parts. Note that the interrupt handler is separated from the main loop.
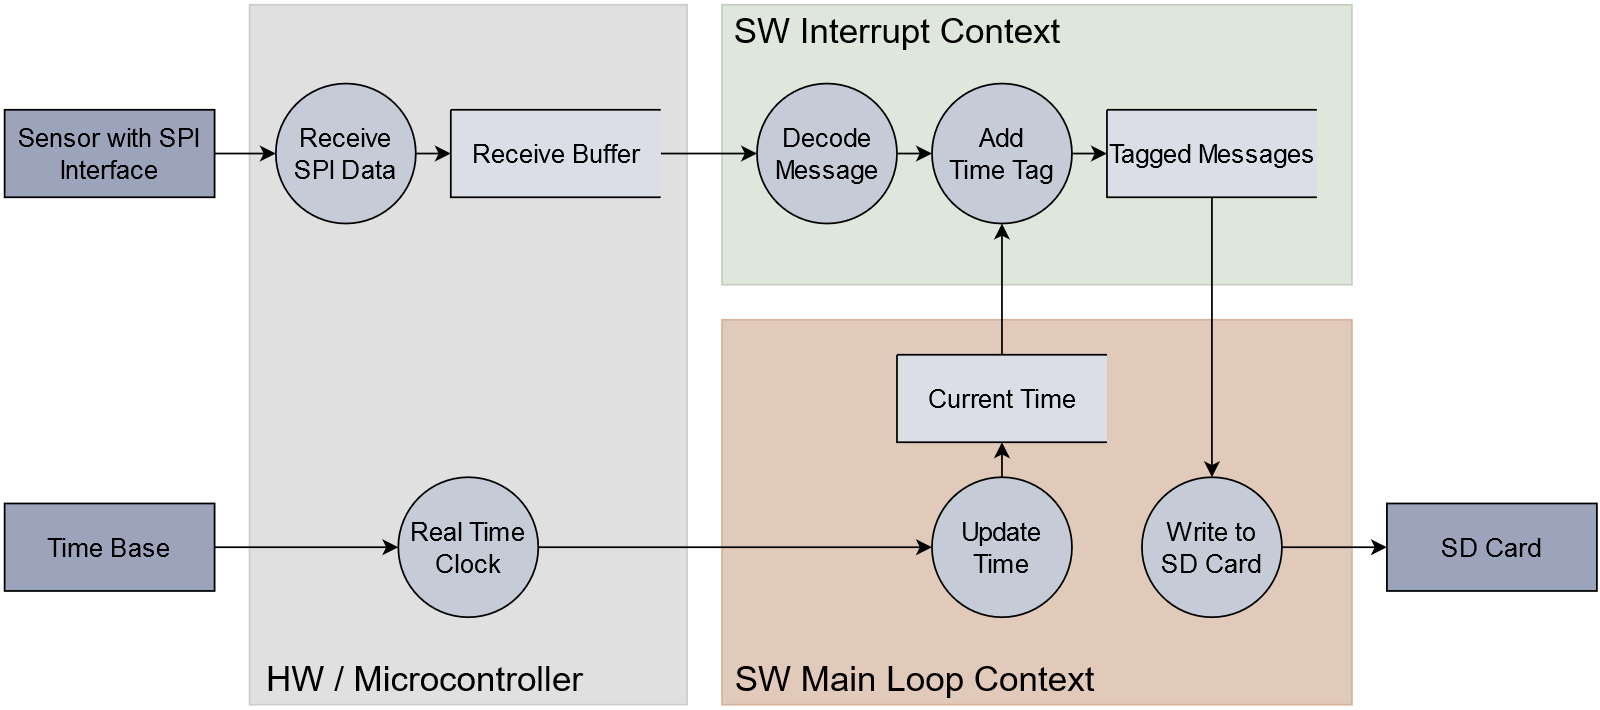
Exemplary data flow diagramm of a data logger

If analog or digital signal processing is a central aspect of your system, data flow diagrams are even more beneficial. These systems usually consist of many independent processing steps which are split into several parallel processing paths. Such structures can be represented in a data flow diagram in an easy and clear manner.

Functional safety

Many standards in the domain of functional safety recommend that software architectures should be defined by means of a data flow analysis and / or verified as part of a software safety analysis, including the following: ISO 26262-6, DO 178C, IEC 61508, ISO 13849, EN 50128. Systematic safety risks can thus be identified at a very early stage of development and the designed system and software can be simplified and optimized at the same time. A data flow analysis is performed using data flow diagrams.

Use data flow diagrams!

Data flow diagrams are easy to read, support the understanding of the software architecture, and make communication with involved people easier. Weak points and errors in your system can be discovered early on. The result is a better system architecture and a reduced number of systematic errors. Data flow diagrams are therefore very effective. Hence, it is worth going through the modest effort to create them. A data flow diagram can be created in one to two days, depending on its complexity. In contrast, the search for a systematic error can take weeks and cause enormous loss of reputation.

Use our SolceptClinic and send me your specific questions about system architecture. And best of all: this first time-boxed consultation of 30 minutes does not cost you anything.

Daniel Megnet

Do you have additional questions? Do you have a different opinion? If so, email me  or comment your thoughts below!

Would you like to benefit from our knowledge? Visit our contact page!

Author

Comments

No Comments

What is Your Opinion?

* These fields are required

Let us discuss your idea/ your project